Business Central - Analyze Page List
If you were to ask me 10 years ago if you can create a pivot and analysis view within Dynamics NAV/BC, then my response would be to export it into Excel and do it that way. When I first started utilizing Microsoft’s Dynamics NAV over a decade ago, I had always been curious why a list view, I could never truly analyze within the application except needing to export to Excel or utilizing a different tool. Well, Microsoft is finally giving that functionality the love it deserves or giving love to the users. This had been a long time coming in Analyzing, grouping, and pivoting data on list pages while having multiple tabs as cherry on top.
Note: If you download or created a new sandbox, you may need to enable this feature from the feature management. You can do so by following this post.
From virtually any page list, you can toggle Analyze. This would switch the view of the page list into an Excel-like pivot view where you can set or choose the columns, move columns, and set your filters. You can also group data as well! Once you have the view that you like, you will be able to rename the tab, duplicate the tab or click on the plus sign to generate another analyze view.
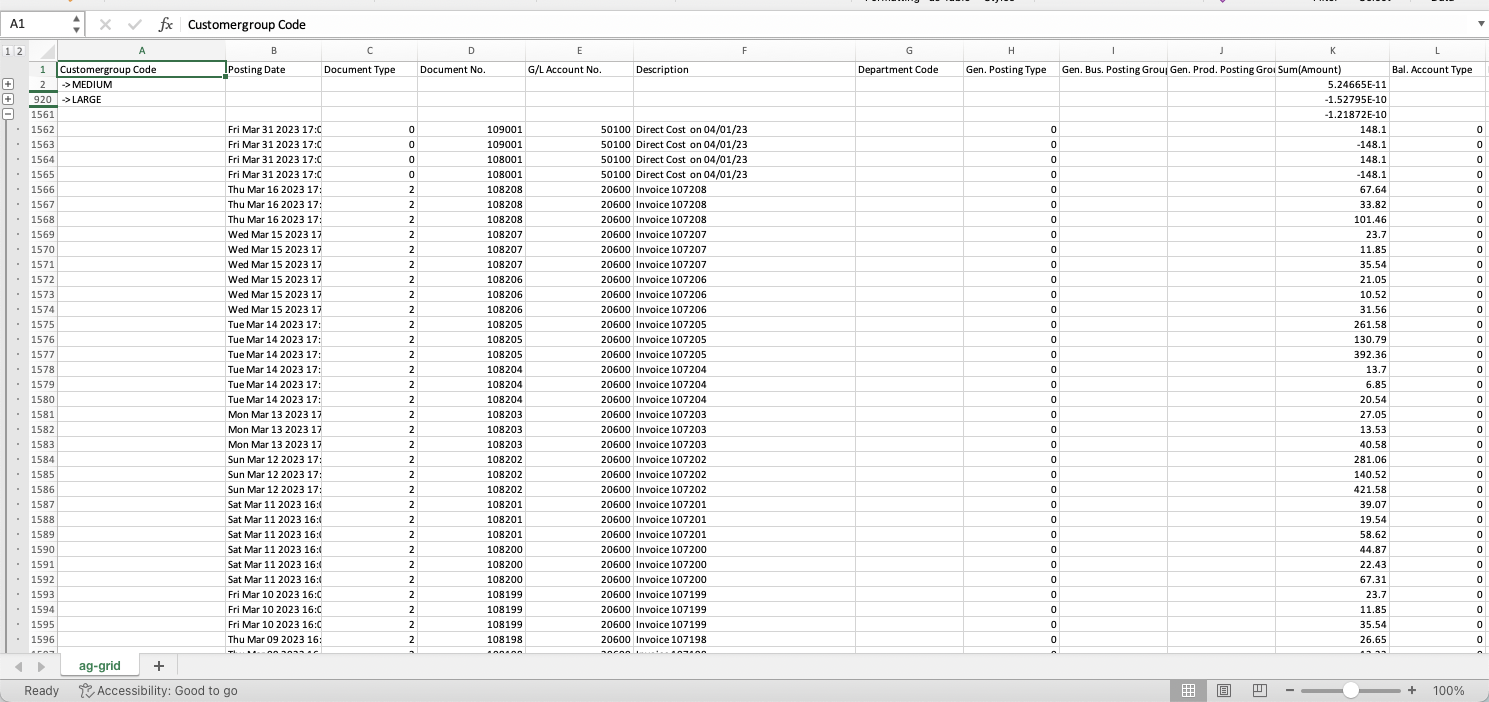
Once you’ve set your analysis view, you can then export this information into Excel for reporting, etc.
This is an incredible feature for any one who just need to quickly analyze page list or transaction list all within Business Central. One thing that I would love to see #MSDyn365BC add to extend this capability would be to add Charts! I am going to call this out now. But what does this mean for PowerBI? I think PowerBI has its place and not everyone needs PowerBI.


